In my current project I am working on a custom map view that needs to display hundreds of labels on the screen. The map view can be zoomed which means that the labels will overlap each other. To avoid that overlapping I implemented an algorithm that hides occluded labels with lower priority. In this article I will describe how I fixed a sluggish zooming experience by improving the runtime complexity of the algorithm from O(n²) to O(n log n).
The Problem
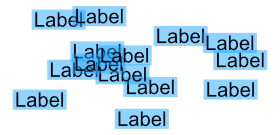
Consider the following layout:

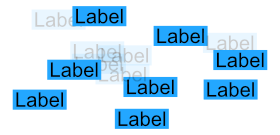
We want to find an efficient algorithm that hides all the labels which are occluded by other higher priority labels. All labels are axis aligned and the labels are uniformly distributed.

For simplicity reasons let’s assume we have the following Label type:
struct Label {
    let id: String
    let frame: CGRect
    let priority: Int
    let isOccluded: Bool
}
Naive Implementation
The straight forward naive solution is to compare each label to all other labels and hide it if the priority is lower.
func naiveAlgorithm(labels: [Label]) {
    // reset the occluded state of all labels
    labels.forEach { $0.isOccluded = false }

    for label in labels {
        let frame = label.frame

        for other in labels {
            // don't compare to self and don't consider labels that have been eliminated already
            if label.id == other.id || other.isOccluded { continue }

            // we need to hide the label if it has
            if other.priority >= label.priority && frame.intersects(other.frame) {
                label.isOccluded = true
                break
            }
        }
    }
}
This works and it is also what I was using until recently. The problem was that on my map I have 403 labels and this algorithm has a runtime complexity of O(n²), which means 403 × 403 = 162.409 checks. You can imagine that zooming performance was sub-optimal.
Logging the actual runtime measurements gives more insight:
naive algorithm: 0.09323489665985107s
naive algorithm: 0.09179198741912842s
naive algorithm: 0.10084295272827148s
naive algorithm: 0.09446895122528076s
naive algorithm: 0.0937960147857666s
naive algorithm: 0.09824109077453613s
naive algorithm: 0.0932919979095459s
naive algorithm: 0.09418392181396484s
naive algorithm: 0.10213398933410645s
naive algorithm: 0.09633302688598633s
naive algorithm: 0.09577906131744385s
naive algorithm: 0.10049700736999512s
naive algorithm: 0.09807693958282471s
Each pass takes roughly 0.1 seconds. Ideally scrolling works with 60Hz, i.e. 1/60s = 0.0166s, so we need to improve by at least one order of magnitude.
A better approach using a Sweep Line Algorithm
Because this is a 2-dimensional problem (checking if bounding boxes of rectangles intersect) a sweep line algorithm will probably improve the performance a lot because it can reduce an n-dimensional problem by one dimension.
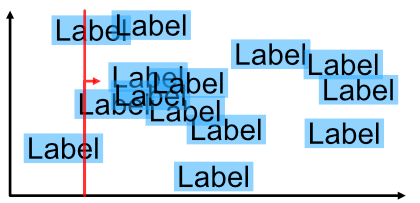
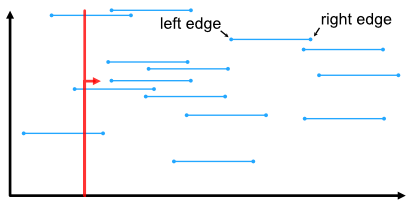
In a sweep line algorithm you basically choose one dimension and let an imaginary line travel from the origin in a direction along that dimension. Along the way you observe “events” and update the outcome of the algorithm for each event. An event consists of the coordinate on the chosen dimension where it occurs, a reference to the object in question (or the object itself) and some meta data if necessary. The first step of the algorithm is to pre-sort the events by their coordinate in ascending order. Then they are processed one by one.
In our case we choose the X-axis and sweep from left to right.

We still need to check if the bounding boxes intersect, but we can reduce the problem to only one dimension for a large portion of the data set. The algorithm events are events along the X-axis, namely “left edge of a label” and “right edge of a label”. At all times we keep a list of “current” labels, i.e. all labels which are currently touched by the sweep line. A label is added to the current labels list when we see a “left edge” event and it is removed again on the “right edge” event.

Before adding a new label to the current labels list we check if it intersects with any of the current labels. If it does we compare the priorities of the intersecting labels. If the existing label has a higher or equal priority than the new label we can stop checking, mark the new label as occluded and move on to the next event. Otherwise (the new label has higher priority) the existing label is removed from the current labels and marked as occluded. We keep checking the new label against the other current labels. If at the end the new label was not eliminated it is added to the current labels.
// a tuple to keep track of the events
typealias SweepEvent = (x: CGFloat, isLeftEdge: Bool, label: Label)

func lineSweep(labels: [Label]) {
    // reset the occluded state of all labels in O(n)
    labels.forEach { $0.isOccluded = false }

    // build the event list in O(n)
    var events = [SweepEvent]()
    for label in labels {
        events.append(SweepEvent(x: label.frame.minX, isLeftEdge: true, label: label))
        events.append(SweepEvent(x: label.frame.maxX, isLeftEdge: false, label: label))
    }

    // Sorting is done in O(n log n)
    let sortedEvents = events.sorted { $0.x < $1.x }

    // The current labels list, which is actually a dictionary
    // for efficiency reasons (O(1) access time)
    var currentLabels = [String: Label]()

    for event in sortedEvents { // iterate the labels in O(n)
        if event.isLeftEdge {
            // on left edge, add the label to the current labels
            let newlabel = event.label

            // but first check if the new label overlaps any current labels
            var shouldAddNewlabel = true
            for label in currentLabels.values {
                if label.frame.intersects(newlabel.frame) {
                    // We have an overlap. Eliminate the label with the lower priority

                    let labelToRemove: Label
                    if label.priority >= newlabel.priority {
                        labelToRemove = newlabel
                    } else {
                        labelToRemove = label
                    }

                    labelToRemove.isOccluded = true
                    currentLabels[labelToRemove.id] = nil

                    if labelToRemove.id == newlabel.id {
                        // if the new label is occluded we can stop checking and move on to the next
                        shouldAddNewlabel = false
                        break
                    }
                }
            }

            if shouldAddNewlabel {
                currentLabels[newlabel.id] = newlabel
            }
        } else {
            // on right edge remove the label from current labels
            currentLabels[event.label.id] = nil
        }
    }
}
The defining factor for runtime complexity is now the pre-sorting of the events, which we assume is done in O(n log n). The worst case scenario of the new algorithm would still be O(n²) though and it happens when all labels are overlapping each other, or when they are at least horizontally aligned. In this case all labels would be in the current labels list at the same time. But in the given data set the labels are uniformly distributed across the map, so this does not really happen in practice.
Let’s give it a test run and see how it performs:
line sweep: 0.008331060409545898s
line sweep: 0.008028030395507812s
line sweep: 0.008505940437316895s
line sweep: 0.007843971252441406s
line sweep: 0.0076749324798583984s
line sweep: 0.008057951927185059s
line sweep: 0.007611989974975586s
line sweep: 0.008639931678771973s
line sweep: 0.007596015930175781s
line sweep: 0.007715940475463867s
Sweet! Instead of 0.1s it now takes roughly 0.008s to run the algorithm. We successfully reduced the runtime by one order of magnitude and then some. Zooming on the map is smooth as butter again.
Let me know what you think. You can contact me either via Twitter or email.